Category: Blog
-
Navigating change part 4 : embedding processes and best practice
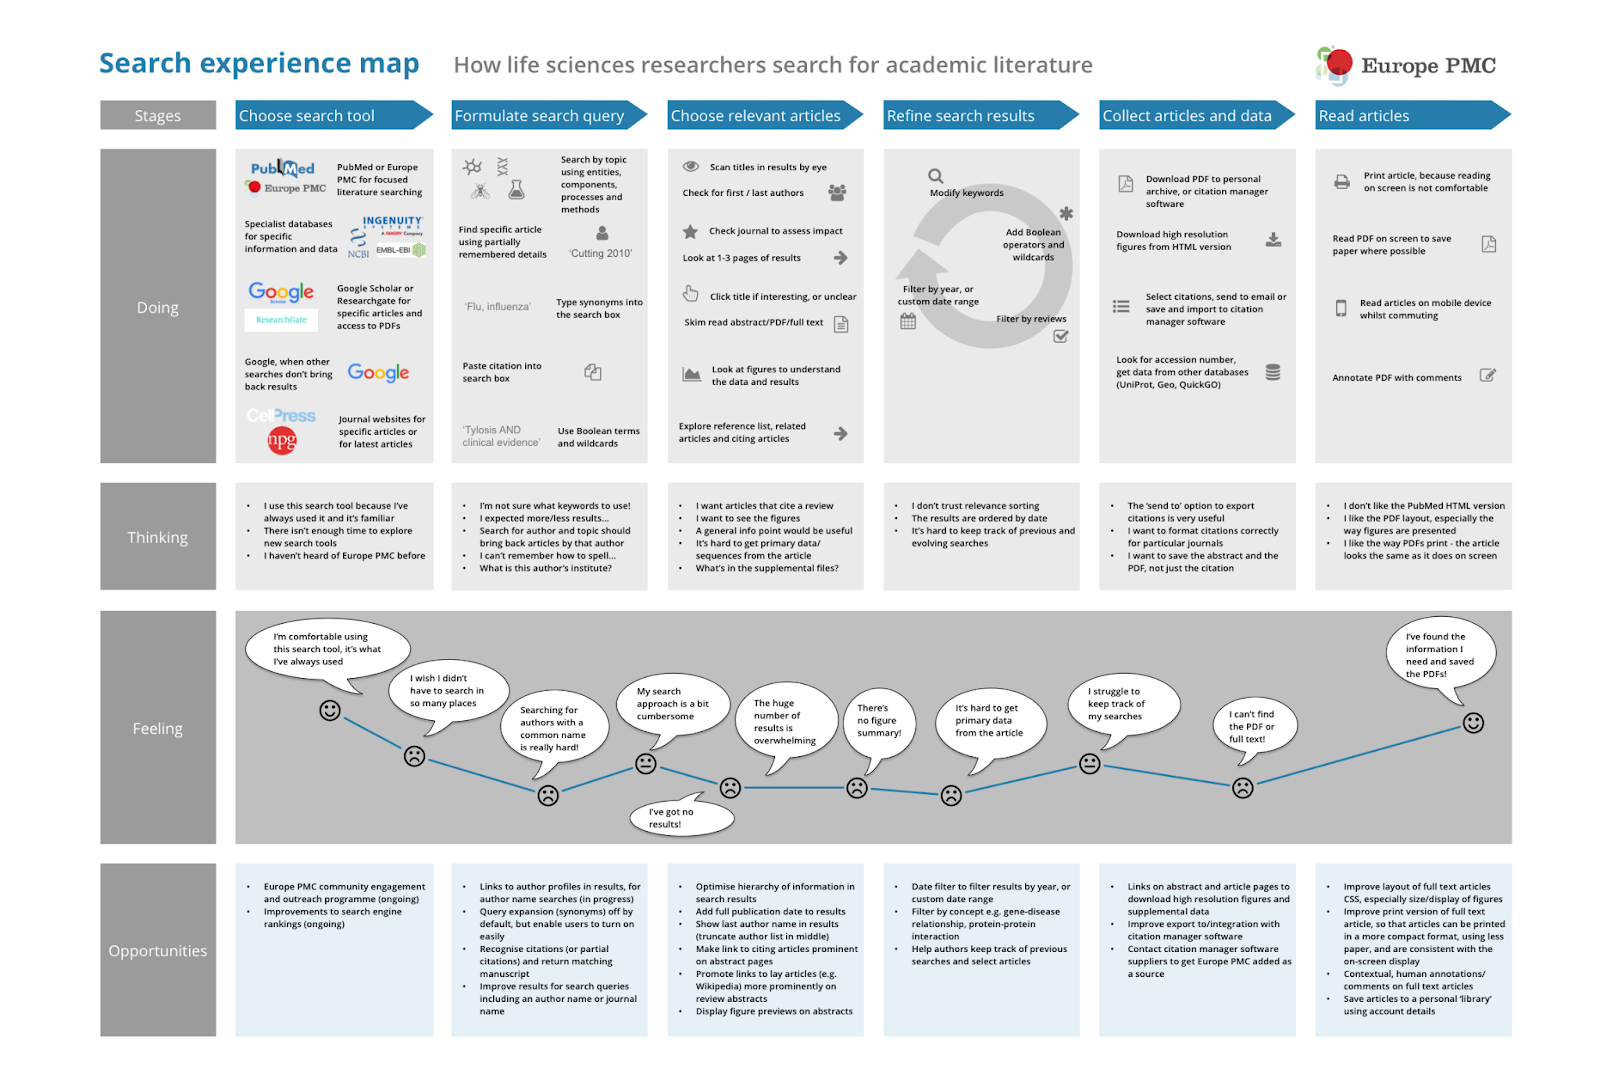
In my last few weeks and months at EMBL-EBI I put a lot of energy and time into improving and embedding team processes and documentation. This broadly fell into four areas: Sharing user research insights I carried out several different user research studies during the 8 years I was in the team. Some of these…
-
Navigating change part 3: leadership during change
In my last post I covered how I influenced stakeholders and strategy in my role at EMBL-EBI. In this post I’ll cover how my role evolved and some of the leadership challenges I faced along the way. Between 2017 and 2019 my team was very busy delivering some significant projects. These included: In 2019 my…
-
Navigating change part 2: influencing stakeholders and strategy

This is my second post in a series about navigating change in my role at EMBL-EBI. In my last post I covered introducing new ways of working to the team. In this post I will cover some examples of how I was able to influence stakeholders and the strategy of Europe PMC. As well as…
-
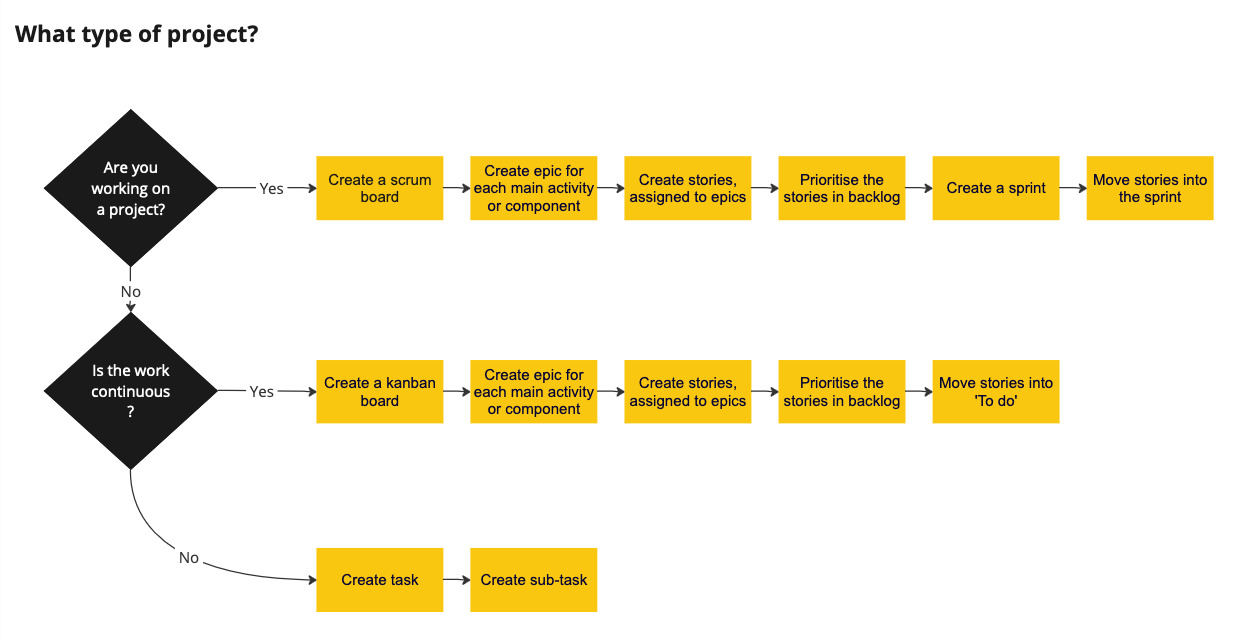
Navigating change part 1: introducing new ways of working
In 2015 I joined EMBL-EBI as a User Experience (UX) Designer for Europe PMC, an open access life sciences literature archive. The role was created because the funders identified a need to improve the user experience of Europe PMC. The team were unfamiliar with UX and it was my job to introduce user-centred design. This…
-
The importance of investing in yourself
The last few years have been challenging. This year I decided it was time to do something I’ve neglected for a few years. I invested in myself and my personal and professional development. For the last 8.5 years I’ve been working at the European Bioinformatics Institute | EMBL-EBI, making it easier for life sciences researchers…